PVOD Regression - Photovoltaic power output prediction based on weather data
PVOD is a public dataset that contains real photovoltaic power output and weather condition data. The regression of this dataset can be used to forecast PV power.
The code is available on my Github repo SmallSquare/PVOD_Regression. Feel free to correct me😊.
Introduction
Why do this? I planned to use this dataset for my research project, but then my supervisor provided me with a better private dataset for research. So some very simple work done before on this dataset can be shown here as a simple example of data processing and modelling.
Why does the photovoltaic power output need to be predicted? Unlike conventional power generation, photovoltaic power is very unstable. But it is heavily influenced by day and night and the weather conditions. So, using weather data is a good idea to forecast the PV power.
Dataset
This dataset includes data from ten power stations in relatively close geographical proximity. I will use station03 as an example.
We can learn some basic information from the provided metadata. Here are columns of the metadata:
Metadata:
- Station_ID
- Capacity
- PV_Technology
- Panel_size
- Module
- Inverters
- Layout
- Panel_Number
- Array_Tilt
- Pyranometer
- Longitude
- Latitude
Then, we just delve directly into the specific data. station03 has 14688 entries. Here are categorized columns of the dataset of station03:
Time:
- datetime
Weather:
- nwp_globalirrad
- nwp_directirrad
- nwp_temperature
- nwp_humidity
- nwp_windspeed
- nwp_winddirection
- nwp_pressure
- lmd_totalirrad
- lmd_diffuseirrad
- lmd_temperature
- lmd_pressure
- lmd_winddirection
- lmd_windspeed
Photovoltaics:
- power
We now have a general view of what the data set looks like. Further, to set the stage for modelling, a correlation analysis is required.
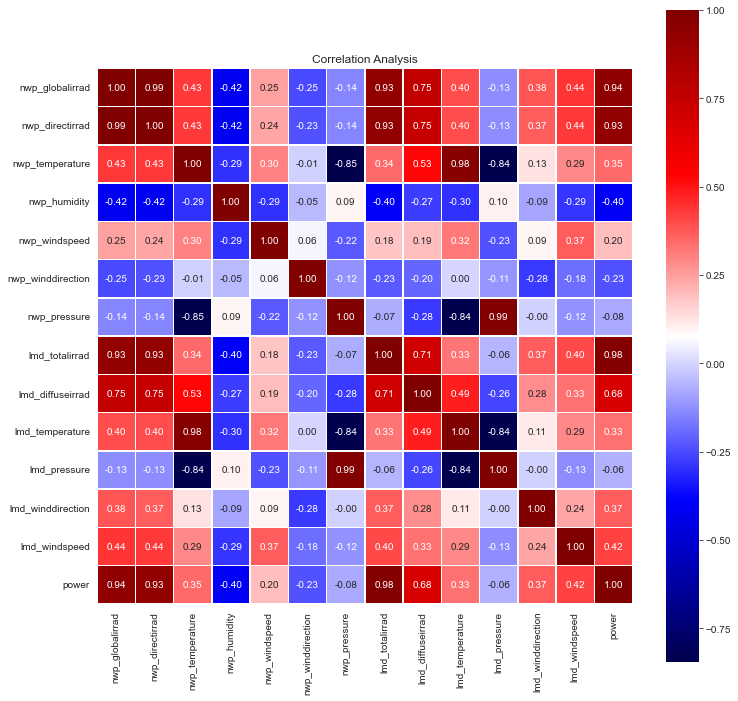
It can be found in the heat map that features of radiation take the highest correlation to the power output. But we will drop columns of radiation later because sometimes the radiation is not that easy to measure without a pyranometer and this is almost linearly related to the power output. This may not reflect value in the actual forecast.
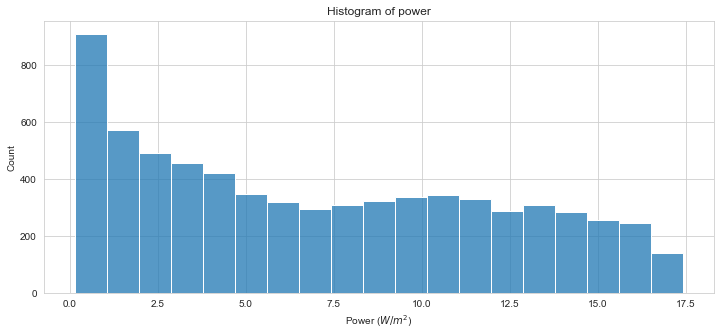
Also, we can observe the distribution of the power output.
Feature engineering and feature selection
The datetime is pretty important and we need to do some engineering on it. For a cyclic feature like date or time, to keep the distance among values in a cyclic feature reasonable, we should encode it. The exact method and rationale can be found in Pierre-Louis Bescond’s blog → Cyclical features encoding, it’s about time. His blog is easy to understand and has inspired me well.
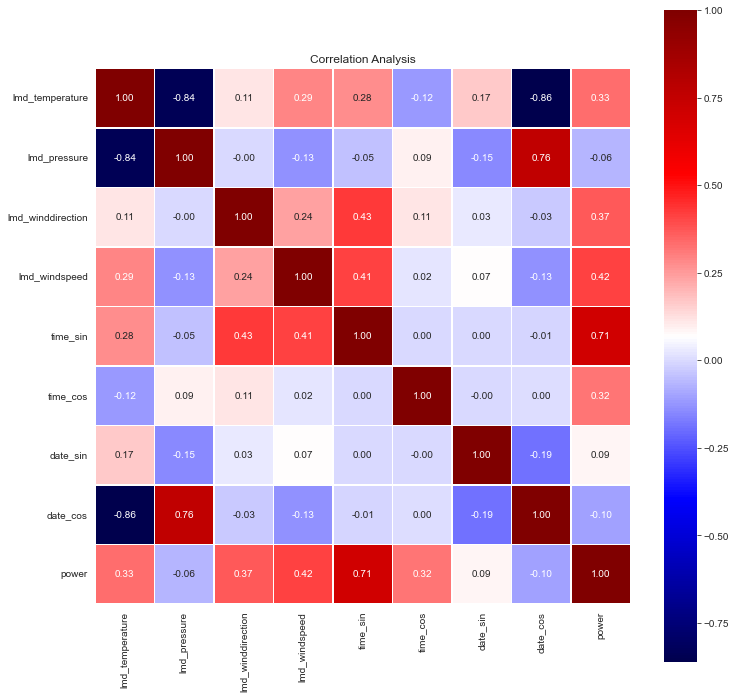
Then, we only select the following locally measured data:
(As you can see, datetime now becomes time_sin, time_cos, date_sin and date_cos)
1 | [lmd_temperature', |
We can do a new correlation analysis on processed features and target variable power.
Modelling
Well, now we are finally ready to model. Since this is just a simple try on PVOD, I will use models in scikit-learn package.
Here is the performance comparison of models. The following performance is for reference only, as we have not looked carefully for hyperparameters.
| Model | MAE | MSE | RMSE | R-square |
|---|---|---|---|---|
| RF | 0.5162 | 1.1332 | 1.0646 | 0.9524 |
| GBM | 0.5841 | 1.1142 | 1.0556 | 0.9532 |
| MLP | 1.1181 | 3.7166 | 1.9278 | 0.8440 |
Although we didn’t work carefully on hyperparameters, Random Forest still give us a good prediction.
The blue line is the prediction, and the black line is the ground truth, we can see how close the prediction of GBM and RF made is to the ground truth.


Feature importance
The RF and GBM can tell the importance of features:
1 | - RF Feature Importance - |
1 | - GBM Feature Importance - |
It can be noticed that features of time are the most important features, as irradiance varies at different times of the day. Apart from this, the temperature is the next most important feature.
Pressure and date also have an impact on the power output, but the influence of windspeed and winddirection are minimal.
Tail
As a reminder, this is only a small attempt on PVOD and as such is deficient in many aspects. Also, the code can be found in my repository SmallSquare/PVOD_Regression.
Thanks for reading.😉
References
PVOD on Science Data Bank: PVOD v1.0: A photovoltaic power output dataset - Science Data Bank
PVOD on Github: PVODataset
PVOD on ScienceDirect: A photovoltaic power output dataset: Multi-source photovoltaic power output dataset with Python toolkit
Machine Learning Modeling of Horizontal Photovoltaics Using Weather and Location Data
Predicting solar power output using machine learning techniques
PVOD Regression - Photovoltaic power output prediction based on weather data